
shop now
book classes
Master the Markets
shop now
book classes
Mathson Mathew
Forex Mentor • Published: 23 October 2026 • 11 min read
Last updated: 23 October 2026
Profile LinkMost beginners don't lose money because they can't predict the market. They lose because they skip the fundamentals.
Forex trading often looks simple from the outside—buy, sell, and wait for the price to move. In practice, good trading decisions depend on understanding how price behaves, managing risk, and following a repeatable process.
Before focusing on winning trades, a trader needs to understand what the market is actually doing.
That is where market structure becomes important.
Market structure helps traders read the sequence of highs and lows created by price. It provides context for whether a market is broadly moving upward, moving downward, or trading without a clear direction.
This foundation also connects naturally with broader price-action frameworks such as Smart Money Concepts
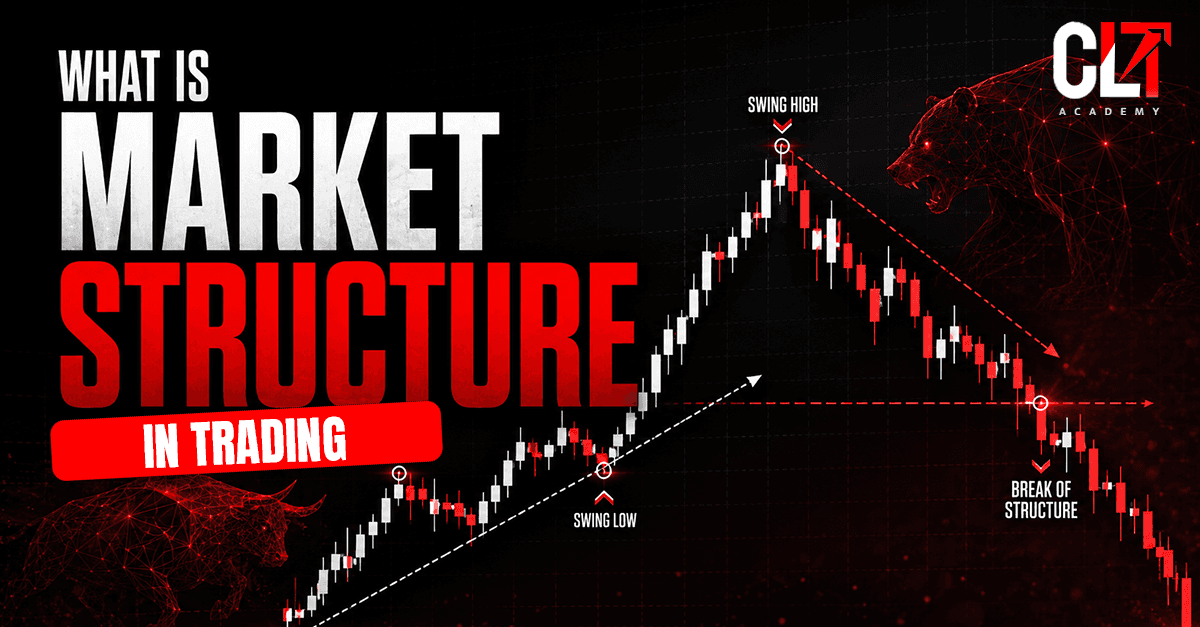
Market Structure is the way price moves and forms a sequence of higher highs, higher lows, lower highs, and lower lows on a chart. By studying these movements, traders can identify whether the market is generally trending upward, trending downward, or moving sideways. A series of higher highs and higher lows can indicate an upward structure, while lower highs and lower lows can indicate a downward structure. When price breaks an important previous high or low, it may signal a potential change in the existing structure. Understanding market structure helps traders read price action more clearly and make decisions based on how the market is actually moving rather than simply reacting to individual candles.
In this guide, we will break down market structure trading in simple terms, including Higher Highs, Higher Lows, Lower Highs, Lower Lows, Break of Structure (BOS), Change of Character (CHoCH), multi-timeframe analysis, common mistakes, and how to include market structure in a practical trading plan.
Build stronger market-analysis skills with CLT Academy's Advanced Trading Course.
Market structure is the way price forms a sequence of highs and lows over time. It gives traders a framework for understanding the current behaviour of a market.
In simple terms, it helps identify whether price is generally:
For example, imagine EUR/USD moves from 1.0800 to 1.0900, pulls back to 1.0850, and then rises to 1.0950. The market has created a Higher High at 1.0950 and a Higher Low at 1.0850.
A common beginner mistake is to see a few rising candles and immediately search for a buy. A structured approach first asks whether those movements are creating meaningful swing highs and lows.
At CLT Academy, market structure is taught as part of a wider process that combines market context, risk management, disciplined execution, and repeatable analysis.
Four terms form the foundation of market structure trading.
Term
Meaning
Higher High (HH)
Price moves above a previous significant high.
Higher Low (HL)
Price pulls back but stays above a previous significant low.
Lower High (LH)
Price rises but fails to reach a previous significant high.
Lower Low (LL)
Price falls below a previous significant low.
A simplified bullish sequence looks like:
HH → HL → HH → HL
A simplified bearish sequence looks like:
LH → LL → LH → LL
The challenge is deciding which highs and lows actually matter. If every tiny movement is marked as a structural point, the chart becomes cluttered and the broader picture becomes harder to read.
This is one of the first ideas beginners encounter when learning Forex Trading for Beginners
The goal is not to label every candle. It is to identify meaningful swing points and understand how they interact.
Improve your chart-reading skills with CLT Academy's Advanced Trading Course.
A bullish market structure generally develops when buyers continue pushing price towards new highs while pullbacks hold above important previous lows.
The basic sequence is:
HH → HL → HH → HL
A bullish structure usually shows:
New highs being created Pullbacks holding above important lows. An overall upward sequence. Suppose a currency pair moves from 1.1000 to 1.1100, pulls back to 1.1050, and then rises to 1.1150. The 1.1050 area can be viewed as a Higher Low, while 1.1150 becomes a Higher High.
If that sequence continues, the bullish structure remains intact. A single bearish candle does not automatically change that structure. The trader needs to consider whether an important structural low has actually been broken.
This is why structure can be more useful than reacting to individual candles. A candle shows a short-term movement; structure gives that movement context.
Build a more structured approach to market analysis with CLT Academy's Advanced Trading Course
Bearish market structure is generally characterised by Lower Highs and Lower Lows.
The basic sequence is:
LH → LL → LH → LL
A bearish structure usually shows:
Price failing to create new highs Previous important lows being broken Rallies forming lower highs For example, a currency pair falls from 1.1000 to 1.0900, rallies to 1.0950, and then falls to 1.0850. The 1.0950 becomes a Lower High and 1.0850 becomes a Lower Low.
A bearish market can still experience strong upward movements. A temporary rally does not automatically mean the trend has reversed.
This is an important part of understanding Price Action Trading.
A trader who reacts to one strong bullish candle without considering the broader sequence may mistake a pullback for a reversal.
Break of Structure, commonly called BOS, refers to price breaking an important swing point in a way that may support continuation of the existing market structure.
In a bullish market, if price breaks above a previous significant high, traders may identify that movement as a bullish BOS. In a bearish market, a break below an important low may be viewed as bearish BOS.
The important word is significant. Not every small movement through a previous high or low should automatically be treated as a BOS.
When analysing a possible BOS, consider:
Which swing point was broken? Was it structurally significant? How did price behave after the break? What does the higher timeframe show? What is happening around liquidity? For example, if EUR/USD briefly moves above a previous high with a wick and then falls back, that movement may require a different interpretation from a strong break followed by continued price movement.
BOS should therefore be treated as part of market analysis, not as an automatic entry signal.
CLT Academy's advanced Market Code curriculum connects BOS and CHoCH mapping with price movement, liquidity, Smart Money Concepts and strategy execution.
Change of Character, or CHoCH, is commonly used to describe a potential shift in existing market structure.
Imagine a market forming:
HH → HL → HH → HL
If price then breaks an important Higher Low, the bullish structure may be weakening. This can be interpreted as a potential CHoCH.
The same idea can apply in a bearish market. If price breaks an important Lower High, traders may interpret it as a possible change in market behaviour.
The key word is possible. A CHoCH does not guarantee a reversal.
Concept
General interpretation
BOS
Existing structure may be continuing.
CHoCH
Existing structure may be changing.
Terminology can vary between trading methodologies, so traders should understand how these concepts are defined within the framework they are using.
For traders progressing from Forex Trading for Beginners to advanced price-action analysis, understanding continuation versus potential structural change is an important step.
Go deeper into BOS, CHoCH and Smart Money Concepts with CLT Academy's Advanced Trading Course
One of the biggest mistakes in market structure trading is analysing only one timeframe.
A market can look bullish on a 5-minute chart while remaining bearish on a 4-hour chart. Both observations can be correct because they describe different layers of price movement.
For example:
Timeframe
Structure
4-Hour
Bearish
1-Hour
Bearish
5-Minute
Bullish
The bullish movement on the 5-minute chart could simply be a pullback inside the larger bearish structure.
A practical process can be:
Identify the broader market structure. Mark important highs and lows. Move to a lower time frame. Look for setups that fit the broader context. Define the risk before entering. Imagine a trader sees a bullish breakout on a 5-minute chart and immediately takes a long position. If the 4-hour chart remains bearish and price is approaching major resistance, that lower-timeframe breakout may need to be viewed differently.
Multi-timeframe analysis can therefore provide context before a trade is considered.
CLT Academy's Profit Matrix curriculum also focuses on moving from broad market context towards more structured analysis and execution.
Develop stronger multi-timeframe analysis skills with CLT Academy's Advanced Trading Course.
Market structure is closely connected with Smart Money Concepts, commonly known as SMC.
SMC is a broader framework that can include:
Market structure Liquidity Break of Structure Change of Character Order blocks Fair Value Gaps Understanding Smart Money Concepts
can therefore give traders a broader framework for interpreting why certain price movements may matter.
For example, a trader may identify a structural shift and then study liquidity or an Order Block – Internal Link: Order Blocks
to understand where price could potentially react.
An order block should not automatically be treated as a guaranteed entry zone simply because price reacted there previously.
The important question is how the concepts fit together. More concepts do not automatically create better analysis.
CLT Academy's Market Code curriculum brings together price movement logic, Smart Money Concepts, liquidity, BOS/CHoCH mapping and real-time strategy execution.
Knowing the terminology is one thing. Applying it correctly is another.
Common mistakes include:
Treating every small movement as structure — charts become cluttered. Treating every BOS as an entry signal — a structural break is mistaken for a trade setup. Ignoring higher-timeframe structure — lower-timeframe signals are taken without context. Confusing a pullback with a reversal — temporary movement is mistaken for a trend change. Adding too many concepts — analysis becomes complicated instead of clearer. Forgetting risk management — a good market view can still produce poor trade outcomes. This is where Risk Management in Trading becomes essential.
When reviewing beginner trades, one common pattern is clear: considerable attention goes into finding the perfect entry, while much less attention goes into deciding what happens if the analysis is wrong.
Market structure helps form the market view. Risk management controls the consequence when that view fails.
Market structure becomes more useful when it becomes part of a repeatable process.
Step
Action
Identify the higher timeframe
Determine whether the broader market is bullish, bearish or ranging.
Mark swing points
Focus on meaningful highs and lows.
Identify structural changes
Watch for potential BOS or CHoCH.
Find areas of interest
Consider relevant liquidity, order blocks, support and resistance.
Define the risk
Set invalidation and determine position size.
Execute the plan
Follow the rules instead of reacting emotionally.
Review the trade
Record the decision, outcome and whether the plan was followed.
This turns market structure from a theoretical concept into part of a repeatable trading routine.
For example, a trader who records whether each trade aligned with the higher-timeframe structure may discover that many losing trades came from taking lower-timeframe setups against the broader direction.
That observation can lead to a practical adjustment: filter those setups more carefully or create separate rules for counter-trend trades.
A Trading Journal can make this review process more useful by helping traders record decisions and recurring mistakes.
CLT Academy's broader trading education approach also places structure, discipline, risk control and market awareness at the centre of the learning process.
No.
Market structure is an important part of technical analysis, but it is not a complete trading strategy by itself.
A trader also needs to understand:
Risk management, Position sizing, Trade execution, Trading psychology, Market conditions, A clearly defined trading plan, Trade review and journaling. Most importantly, market structure does not predict the future with certainty.
A bullish structure can turn bearish. A bearish structure can reverse. A clear trend can become a range. New price information can change the structure at any time.
This is why Trading Psychology and Discipline matter alongside technical analysis.
A trader may correctly identify a structure but still make poor decisions by entering too late, increasing position size after a loss, or abandoning the original trading plan.
The objective is not to predict every movement correctly. It is to build a process that allows informed decisions while controlling risk when the market behaves differently from expectations.
Market structure gives traders a framework for understanding price beyond individual candles.
By identifying Higher Highs, Higher Lows, Lower Highs and Lower Lows, traders can begin to distinguish between bullish, bearish and unclear market conditions. From there, BOS and CHoCH can help identify potential continuation or structural change.
But market structure should never be treated as a crystal ball.
It works best when combined with higher-timeframe context, risk management, position sizing, execution and a repeatable trading plan.
Traders looking to progress further can explore Smart Money Concepts and Order Blocks as part of a broader approach to price analysis.
The goal is not to predict every market movement. It is to understand the market better, manage risk when the analysis is wrong, and make decisions through a process that can be repeated.
1. What is market structure trading?
Market structure trading is the practice of analysing the sequence of highs and lows created by price to understand the market's current direction, behaviour and possible structural changes.
2. What are HH, HL, LH and LL in trading?
HH means Higher High, HL means Higher Low, LH means Lower High and LL means Lower Low. These four terms describe the basic price movements that form market structure.
3. Is BOS the same as CHoCH?
No. BOS generally refers to a break that supports continuation of the existing structure, while CHoCH is commonly used to describe a potential change in existing market behaviour or structure.
Investopedia — Technical Analysis — https://www.investopedia.com/technical-analysis-4689657CMT Association — https://cmtassociation.org/CLT Trading Academy — https://clttradingacademy.com/

17 March 2026 • 3 min read

17 March 2026 • 4 min read

17 March 2026 • 3 min read
Market Code
14 weeks
Designed for experienced traders seeking structured mastery, this 14-weeks program unpacks high-level chart analysis, risk-to-reward systems, and real-time strategy execution. Elevate from scattered results to strategic consistency
CLT Vantage
28 weeks
This 6-month program doesn’t just teach trading. It builds leaders capable of thinking like fund managers, mentoring others, and navigating market chaos with clarity.