
shop now
book classes
Master the Markets
shop now
book classes
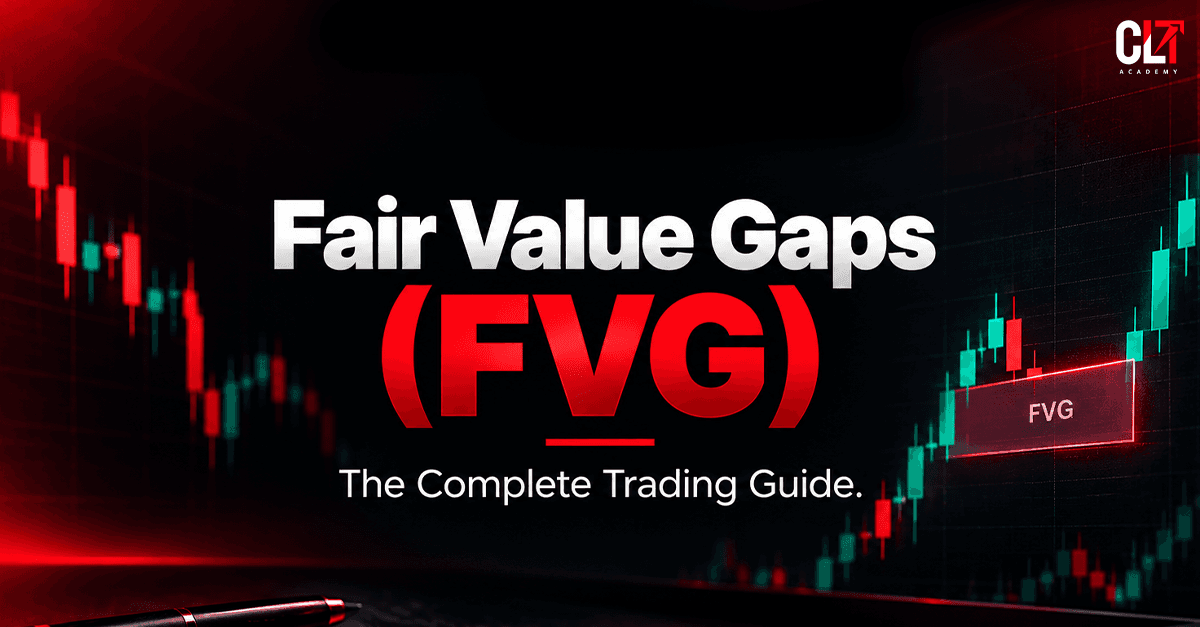
A Fair Value Gap (FVG) is a three-candle price pattern in which the first and third candles do not overlap across a price zone, often after a strong directional move. Traders study this zone alongside market structure, liquidity and confirmation. An FVG is an area of interest, not a guaranteed entry or prediction.
Understanding Fair Value Gaps is an important part of learning how price moves through periods of strong buying or selling pressure. Rather than treating an FVG as a standalone signal, traders can use it to study displacement, market structure, liquidity and potential retracement areas within a broader trading plan.
Price does not always move smoothly from one level to another.
Sometimes, the market moves so aggressively in one direction that it leaves an imbalance between consecutive candles. In Smart Money Concepts (SMC), this price imbalance is commonly referred to as a Fair Value Gap, or FVG.
For traders learning fair value gap trading, identifying the three-candle pattern is only the starting point. The more important questions are: Why did the gap form? Where did it form? What was the market structure at the time? And what should a trader do if price returns to the zone?
A Fair Value Gap can be useful as a price-action reference, but it is not a guaranteed entry, support or resistance level. Price may react to an FVG, partially retrace through it, completely fill it or move through it without the expected reaction.
This complete guide explains what Fair Value Gaps are, how they form, how to identify bullish and bearish FVGs, how to combine them with market structure and order blocks, how to plan a trade around them, and the mistakes traders should avoid.
View CLT Academy's SMC Course to learn Smart Money Concepts in a structured way.
A Fair Value Gap is a three-candle price pattern in which the wicks of the first and third candles do not overlap, leaving a price zone created by the strong movement of the middle candle.
The middle candle is usually a strong displacement candle. It shows that price moved rapidly in one direction.
A simple way to understand the structure is:
For a bullish FVG:
Candle 1 High < Candle 3 Low
For a bearish FVG:
Candle 1 Low > Candle 3 High
The important point is that the FVG is the price zone between the relevant wicks of Candle 1 and Candle 3. It is not simply the large middle candle.
Fair Value Gaps are widely used within Smart Money Concepts, where traders study price structure, liquidity, displacement and institutional-style price behaviour together. CLT Academy also teaches FVGs as part of its broader SMC and institutional concepts curriculum.
View CLT Academy's SMC Course to understand FVGs within the wider SMC framework.
To understand an FVG, it helps to understand what aggressive price movement looks like.
Markets constantly match buying and selling interest. But when buying or selling pressure becomes heavily one-sided, price can move rapidly through a range.
That rapid movement can leave a three-candle imbalance on the chart.
In SMC-based trading, this area is studied as an inefficiency created by aggressive price delivery. It is an interpretation of price action rather than direct proof of where a particular institution placed an order.
For example, imagine EUR/USD is trading around 1.1000.
A sudden wave of buying pushes price sharply higher:
1. Candle 1 trades around the previous range.
2. Candle 2 produces a strong bullish expansion.
3. Candle 3 opens and continues higher without overlapping Candle 1's high.
The space between Candle 1's high and Candle 3's low becomes the bullish FVG.
The important information is not simply that a gap exists.
The movement that created the gap is the story.
Was it a strong breakout? Did it follow a liquidity sweep? Did it break market structure? Did it occur during a high-volatility event?
Those questions can make the difference between simply spotting an FVG and understanding it.
Build your foundation in price action and SMC with CLT Academy's SMC Course.
A bullish FVG develops during a strong upward move.
The basic structure is:
Candle 1 → Strong Bullish Displacement → Candle 3
If Candle 3's low remains above Candle 1's high, the space between those two prices forms the bullish FVG.
Suppose:
The area between 1.1050 and 1.1060 is the bullish Fair Value Gap.
If price later retraces into this area, a trader may watch how price behaves.
That does not mean the zone automatically becomes support.
Price could:
The FVG therefore becomes an area for observation, not an automatic buy signal.
A stronger bullish setup may occur when the FVG forms alongside bullish market structure, meaningful displacement or other confluence.
Learn how to identify and filter bullish FVG setups with CLT Academy's SMC Course.
A bearish FVG is the opposite structure.
It forms during a strong downward movement when Candle 3's high remains below Candle 1's low.
Suppose:
The area between 1.2485 and 1.2500 becomes the bearish FVG.
If price later retraces upward into the zone, traders may observe whether sellers return or whether price continues through the imbalance.
Again, the gap itself does not predict the outcome.
A bearish FVG formed during a clear bearish market structure may provide a different context from a bearish FVG appearing randomly during a strong bullish trend.
This is why fair value gap trading is more about context than simply finding rectangles on a chart.
View the SMC Course to understand bearish FVGs as part of a complete trading framework.
The word “gap” can create confusion.
A traditional price gap usually refers to a visible discontinuity between one trading period and another, where price opens significantly above or below the previous period's range.
A Fair Value Gap in SMC is different.
It is identified through a three-candle structure and the non-overlap between the first and third candles. It can appear inside an otherwise continuous price chart.
Understanding this distinction prevents a common beginner mistake: assuming every visible gap on a chart is an FVG.
The pattern and the rules used to identify it matter.
Learn the difference between common price patterns and SMC concepts with CLT Academy's SMC Course.
Finding an FVG is relatively simple.
Finding one worth considering requires more analysis.
A practical process is:
Before marking an FVG, determine whether the market is:
Market structure provides the broader context for the price movement.
You can learn more about this through [Market Structure – Internal Link: SMC Pillar], where the relationship between structure, liquidity and SMC concepts can be explored in greater detail.
Look for three consecutive candles.
For a bullish FVG:
Candle 3 low > Candle 1 high.
For a bearish FVG:
Candle 3 high < Candle 1 low.
The middle candle should represent meaningful directional movement.
A tiny movement in a highly congested market may not carry the same significance as a strong expansion candle.
Ask:
Mark the relevant space between Candle 1 and Candle 3.
Do not automatically mark the entire middle candle as the FVG.
This process keeps the chart cleaner and prevents traders from treating every small imbalance as a potential trade.
Learn a structured approach to identifying FVGs with CLT Academy's SMC Course.
Not every FVG deserves the same level of attention.
There is no universally accepted formula that can guarantee that one FVG will outperform another. However, traders can evaluate the context around a gap.
Consider two bullish FVGs.
The first appears randomly in the middle of a narrow range.
The second appears after price sweeps a previous low, aggressively moves upward and breaks a meaningful swing high.
Both are technically FVGs.
But the second has a much richer market story.
This is why experienced traders often focus less on the number of FVGs they can identify and more on the quality of the context surrounding them.
View the SMC Course to learn how to evaluate FVGs through market context and confluence.
Market structure can help traders understand whether an FVG is forming with or against the prevailing price direction.
Imagine a market making:
Higher High → Higher Low → Higher High
During the next bullish expansion, a bullish FVG forms.
The FVG is now part of a broader bullish sequence.
If price later retraces into the FVG, the trader can study whether the broader bullish structure remains intact.
The same principle can be applied to a bearish market.
Lower Low → Lower High → Lower Low
A bearish FVG forming during another downward expansion may fit the broader bearish narrative.
The key is not to assume that alignment guarantees a successful trade.
Market structure is context, not certainty.
A trader can therefore use the following sequence:
Market Structure → Liquidity → Displacement → FVG → Confirmation → Risk Management
That creates a more complete process than using the FVG alone.
Strengthen your understanding of market structure and SMC with CLT Academy's SMC Course.
Liquidity is another important part of SMC analysis.
Markets frequently move around obvious highs and lows where traders may have placed stop-loss orders or pending orders.
A common SMC setup may look like:
Liquidity Sweep → Displacement → Market Structure Shift → FVG
For example, price may briefly move below a previous low before sharply reversing upward.
The strong upward movement can then create a bullish FVG.
In this situation, the FVG is not analysed independently.
The liquidity event provides context for the displacement, while the FVG identifies the area created during that movement.
This is one reason SMC traders often study liquidity, structure and FVGs together rather than treating each concept as an independent strategy.
However, traders should avoid assuming that every movement above a high or below a low is automatically a “liquidity sweep.” The broader price behaviour still matters.
Learn how liquidity and FVGs connect inside the SMC framework with CLT Academy's SMC Course.
FVGs and order blocks are frequently used together in SMC analysis.
An FVG identifies an imbalance created during a strong move.
An order block is commonly used to identify a price area associated with the move preceding strong directional displacement.
When the two appear close together, traders may consider the combination as additional confluence.
For example:
Order Block → Displacement → FVG → Retracement
Price may later return toward the area containing both the order block and FVG.
At that point, the trader can study the reaction rather than assuming that either zone must hold.
Our detailed [Order Blocks Explained – Internal Link: Order Blocks] guide can help readers understand the other side of this relationship and how order blocks are identified.
The important principle is simple:
More confluence does not mean guaranteed success.
A chart covered with five SMC labels is not automatically better than a clean chart with one well-understood setup.
View the SMC Course to learn how FVGs and order blocks can be analysed together.
One of the most discussed ideas in FVG trading is the return of price to the imbalance.
Price may return to an FVG after the initial displacement.
But there are several possible outcomes.
Price enters the FVG but reverses before crossing the entire zone.
Price trades through the entire FVG.
Price enters the zone and quickly moves away.
Price trades through the zone without producing the expected response.
This is important because the phrase “price will fill the FVG” can easily be misunderstood as a rule.
It is not.
Some FVGs are revisited, while others can remain untouched. Even when price returns, the reaction can vary significantly.
A trader therefore needs a plan for both outcomes:
“What happens if price reacts?”
and
“What happens if price does not react?”
That is where confirmation and risk management become essential.
Learn how to plan FVG setups beyond simply waiting for a price return with CLT Academy's SMC Course.
No.
This is one of the most important points for beginners to understand.
An FVG is a price-action observation, not a promise about future price behaviour.
Some traders build strategies around the expectation that price will revisit an imbalance. But there is no universal rule that every Fair Value Gap must be completely filled.
This creates three possible mistakes:
1. Entering a trade simply because an FVG exists.
2. Assuming price must return to the FVG.
3. Holding a losing position because the trader expects the gap to eventually fill.
A better approach is to treat the FVG as an area of interest and then evaluate what price actually does when it reaches that area.
Trading is about probabilities and risk management, not certainty.
Learn to build probability-based trading decisions with CLT Academy's SMC Course.
Some SMC traders pay particular attention to the midpoint of an FVG.
This is often referred to as the 50% level or, in some methodologies, Consequent Encroachment.
For example, if an FVG extends from 1.1000 to 1.1020, its midpoint is:
1.1010
Some trading plans use this midpoint as an area of interest for entries or confirmation.
But it is important not to turn this into a universal rule.
The 50% level does not guarantee that price will reverse there.
It is simply one method used by some traders to structure their analysis.
The more important question remains:
Does the midpoint fit the broader market structure, liquidity and trade plan?
A technically precise entry at the midpoint is still a poor trade if the overall setup is invalid.
Explore advanced SMC concepts and execution methods through CLT Academy's SMC Course.
Market conditions can significantly change how an FVG should be interpreted.
In a strong trend, FVGs may appear repeatedly as price makes successive directional moves.
For example:
Bullish trend → Bullish displacement → FVG → Retracement → Continuation
Here, traders may study whether the retracement respects the broader bullish structure.
A sideways market can produce multiple small imbalances in both directions.
This can create confusion.
Price may move from one side of the range to another, creating several FVGs without establishing a clear directional trend.
In such conditions, simply trading every FVG can result in overtrading.
This is why identifying the market environment should come before selecting the setup.
The FVG is the tool.
The market context determines how that tool should be interpreted.
Learn how to adapt SMC analysis to different market conditions with CLT Academy's SMC Course.
Major economic announcements can produce extremely fast price movements.
Forex markets can react sharply to events such as:
Such movements can create apparent imbalances and large candles within seconds or minutes.
That does not automatically make every FVG created during news a high-quality setup.
During extreme volatility:
Therefore, a trader should know whether news events are included or excluded from the trading plan before entering an FVG setup.
A good technical setup does not remove execution risk.
Learn disciplined trading and risk management alongside SMC with CLT Academy's SMC Course.
There is no single universal FVG strategy.
A structured process, however, can help remove unnecessary decisions.
Start with a broader timeframe and identify the market structure.
Look for a clear three-candle imbalance created by meaningful displacement.
Ask what caused the displacement.
Was there:
Do not chase the original displacement simply because an FVG has formed.
Decide in advance what confirmation will be required.
This could involve a lower-timeframe structure shift, rejection or another rule within the trader's system.
Determine what price movement would prove the trade idea wrong.
Position size should be calculated according to the amount being risked and the distance to the invalidation point.
The target should also be established before entering, based on the trader's strategy and market structure.
This process creates a complete trading plan rather than an isolated FVG entry.
View the SMC Course to learn a structured approach to FVG analysis and execution.
Consider a hypothetical EUR/USD setup.
The higher-timeframe structure is bullish.
Price then moves below a previous swing low before quickly reversing upward.
A strong bullish displacement follows, creating a bullish FVG.
The sequence looks like:
Liquidity Sweep → Bullish Displacement → FVG → Retracement
Instead of immediately buying the displacement candle, the trader waits.
Price later retraces into the FVG.
At this point, the trader checks:
If the predefined conditions are not met, there is no trade.
This is an important lesson.
The FVG does not create the trade by itself.
The complete setup does.
Now consider a hypothetical GBP/USD setup.
The broader structure is bearish.
Price temporarily moves above a previous swing high and then rejects the area.
Strong selling pressure follows, creating a bearish displacement and a bearish FVG.
The sequence becomes:
Liquidity Sweep → Bearish Displacement → FVG → Retracement
Price later moves back upward into the FVG.
Instead of assuming that the zone must reject price, the trader waits for the predefined confirmation.
If the confirmation appears and the risk parameters are valid, the setup can be considered.
If price breaks the invalidation level without confirmation, the setup is simply discarded.
This approach helps prevent a common psychological mistake: becoming emotionally attached to a zone just because it looked perfect when it first appeared.
There is no single stop-loss or target that works for every FVG.
The stop should be connected to the point at which the original trade idea becomes invalid.
For a bullish setup, that may involve a meaningful structural low or another predefined invalidation point.
For a bearish setup, it may involve a meaningful structural high.
The important part is deciding the invalidation level before entering.
Then position size can be adjusted according to the distance between the entry and stop.
A simple framework is:
Risk per trade → Stop distance → Position size
Targets can then be based on factors such as:
Avoid choosing the target first simply because it produces an attractive risk-to-reward number.
The market structure should support the target.
This is where [Risk Management in Trading – Internal Link: Risk Management] becomes essential. A strong technical setup still needs controlled downside.
Learn risk-controlled SMC execution with CLT Academy's SMC Course.
An FVG on a five-minute chart does not exist in isolation.
The same price movement may be part of a much larger structure on the one-hour or four-hour chart.
For example:
The lower-timeframe FVG may be useful for execution, while the higher-timeframe chart provides context.
A practical multi-timeframe process can be:
1. Start with the higher timeframe.
2. Identify the broad market structure.
3. Mark important price areas.
4. Move down to the execution timeframe.
5. Look for FVGs that fit the broader narrative.
6. Wait for confirmation.
7. Manage the position according to the predefined risk plan.
This approach can reduce the tendency to trade every lower-timeframe FVG.
CLT Academy's advanced curriculum includes multi-timeframe analysis alongside SMC, liquidity and price-movement concepts.
View the SMC Course to develop a multi-timeframe approach to SMC trading.
An FVG can appear during both continuation and reversal scenarios.
The market is already moving in one direction.
A strong displacement creates an FVG.
Price retraces into the FVG while the broader structure remains intact.
The trader looks for continuation.
Price reaches an important area.
Liquidity is taken.
The market then produces strong displacement in the opposite direction and creates an FVG.
The FVG becomes part of the reversal narrative.
The important difference is the context surrounding the gap.
A reversal setup should not be called a reversal simply because an FVG appeared in the opposite direction.
There should be evidence of a meaningful change in price behaviour.
This distinction helps prevent traders from confusing a normal pullback with a genuine market reversal.
The concept looks simple, but several mistakes repeatedly appear in FVG trading.
Multiple FVGs can appear across different timeframes.
Trading all of them turns a structured method into signal hunting.
An isolated FVG tells only part of the story.
Price does not have to return to every gap.
A touch is not automatically confirmation.
Adding more and more SMC labels does not necessarily improve a setup.
No technical pattern eliminates the possibility of loss.
If the setup is invalidated, moving the stop simply to avoid accepting the loss changes the original trade plan.
One of the biggest beginner mistakes is entering after the aggressive move has already happened because the trader is afraid of missing it.
The purpose of the FVG is often to help analyse the retracement opportunity—not encourage traders to chase the initial expansion.
Learning the concept is different from proving that a particular FVG setup works for your trading approach.
Back testing can help.
Instead of looking at one successful chart and assuming the setup works, collect a meaningful sample of historical trades based on the same rules.
For example, define:
Then record the results.
A simple journal can include:
This gives the trader something much more useful than screenshots of winning trades.
It creates data.
Back testing also helps answer an important question:
“Does this particular FVG strategy actually have an edge under the rules being tested?”
That is far more valuable than assuming that a popular concept automatically works.
Technical knowledge is only one part of trading.
A trader may correctly identify an FVG and still make a poor decision because of fear, greed or impatience.
Common psychological problems include:
Imagine a trader sees a perfect-looking bullish FVG.
Price enters the zone.
The planned confirmation does not appear.
Instead of accepting that there is no trade, the trader enters anyway because the FVG “should hold.”
The problem is no longer the FVG.
The problem is the lack of discipline.
A strong trading process therefore needs both technical rules and behavioural rules.
CLT Academy's curriculum also places emphasis on trading psychology, discipline and rule-based execution alongside technical concepts.
View the SMC Course to build technical and psychological discipline together.
Before taking an FVG setup, ask:
The final question is often the most important.
A setup does not become valid simply because it looks attractive.
If it does not meet the rules, there is no requirement to trade it.
Sometimes the best FVG trade is the one you choose not to take.
Learn to turn SMC concepts into a repeatable trading process with CLT Academy's SMC Course.
An FVG can help traders identify an area created during strong directional price movement.
It can help answer:
But an FVG cannot tell you with certainty:
This distinction is critical.
Online trading content can sometimes present FVGs as if they are mechanical signals.
Real trading is more complicated.
The FVG is an analytical tool.
The trading plan determines how that tool is used.
Risk management determines how much is exposed when the analysis is wrong.
And discipline determines whether the trader follows the plan.
View CLT Academy's SMC Course to learn FVGs without relying on signal-based trading.
Fair Value Gaps provide traders with a structured way to study aggressive price movement and the imbalances created during that movement.
The basic pattern is straightforward: three candles, a strong displacement and a non-overlapping area between the first and third candles.
But identifying an FVG is only the beginning.
A more complete approach considers:
The biggest lesson is simple:
Not every FVG deserves a trade.
The objective is not to find as many gaps as possible. It is to understand why a gap formed, whether it fits the broader market context, and whether the setup meets a predefined trading plan.
For a broader understanding of the concept, explore [Smart Money Concepts – Internal Link: SMC Pillar] and [Order Blocks – Internal Link: Order Blocks] to see how FVGs fit into a wider SMC framework.
CLT Academy's advanced programs cover Smart Money Concepts, liquidity, market structure, FVGs, order blocks and risk-controlled execution as part of a structured trading curriculum.
Ready to learn Smart Money Concepts in a structured way? View CLT Academy's SMC Course.
Fair value gap trading is an approach that uses three-candle price imbalances as areas of interest. Traders may study how price behaves when it returns to these zones, usually alongside market structure, liquidity, confirmation and risk management.
A bullish FVG generally forms when the low of the third candle remains above the high of the first candle. A bearish FVG forms when the high of the third candle remains below the low of the first candle. The middle candle is typically the strong displacement candle.
No. Price may revisit an FVG, partially fill it, fully fill it or never return to it. A trader should therefore avoid treating a future FVG fill as a certainty.
No. An FVG is an area of interest, not a guaranteed entry or reversal signal. Market structure, liquidity, confirmation and risk management should be considered before taking a trade.
No. FVG concepts are used by traders across markets including forex, indices, stocks, futures and crypto. However, the way price behaves can vary depending on the market, timeframe and trading conditions.
No. Beginners should first learn how to identify valid FVGs, understand market structure and develop a defined trading plan. Backtesting a specific setup can also help determine whether the rules produce a repeatable outcome.
https://ninjatrader.com/futures/blogs/fair-value-gaps/
https://forextester.com/blog/fair-value-gap/
https://www.plindia.com/blogs/fvg-in-trading/
https://www.mql5.com/en/articles/18669
https://clttradingacademy.com/
26 October 2026 • 11 min read

17 September 2026 • 11 min read

9 September 2026 • 8 min read
Trade Craft
4 weeks
Learn the essentials of trading — from platform basics and price patterns to risk control and market mindset — all in one high-impact, beginner-friendly course..
Profit Matrix
8 weeks
Designed for traders who know the basics but lack execution clarity, this 8-week program dives into advanced trade planning, market psychology, and strategic precision. Take the leap from potential to profitability — and build habits that last a lifetime.